
While the Opposition Party has attacked the Narendra Modi government against a massive fuel price hike with a Bharat Bandh called on September 10, 2018 – on the same date, the BJP Government has revealed a graph of fuel prices on the official Twitter handle.
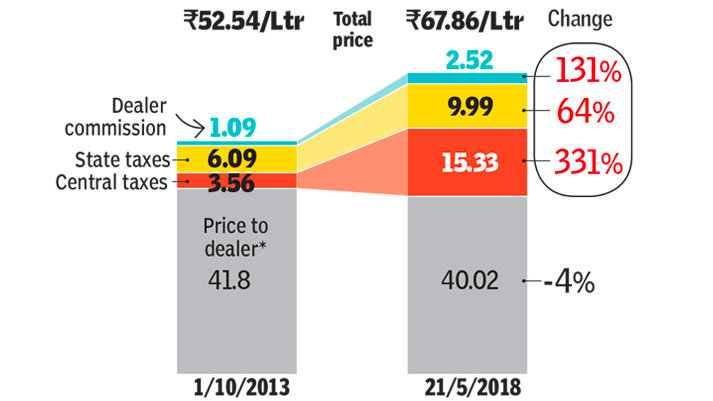
This infographic shared by BJP has been called out by critics as faulty and skewed to con viewers. The Congress has conversely revealed another version of the bar graph, which they claim is the rectified version of the one shared by BJP.
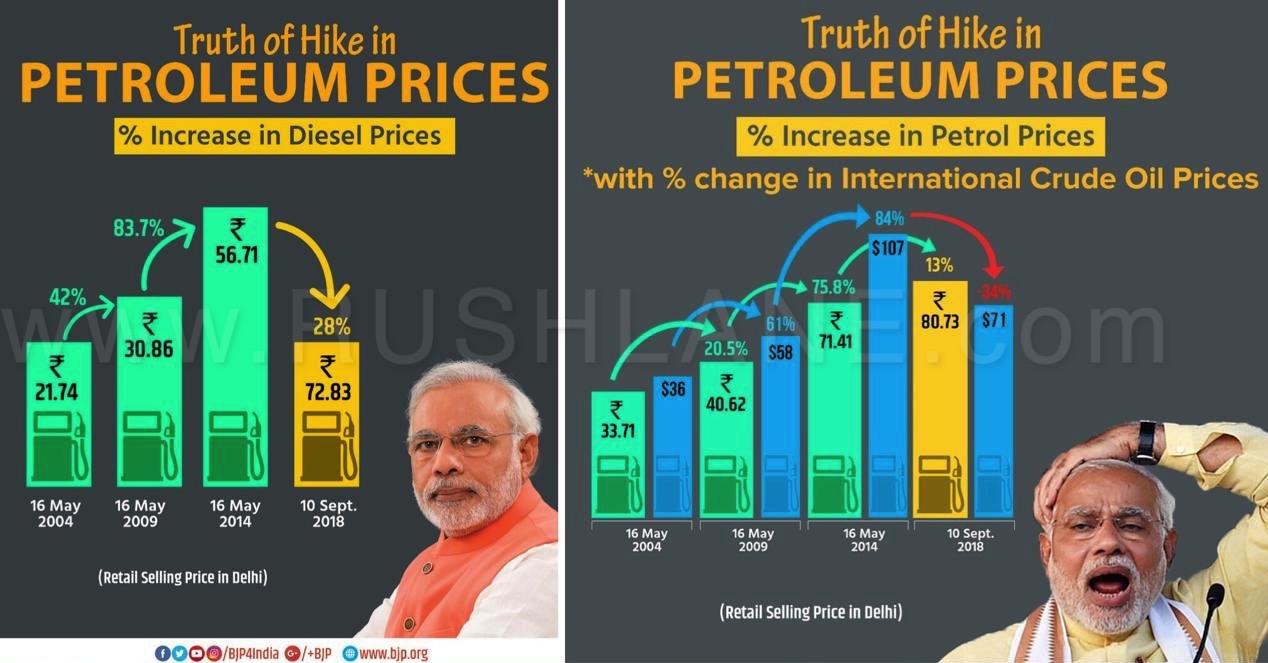
The graph shared by BJP, shows off the percentage increase in diesel prices in India from 16th May 2004 to 16th May 2009 to 16th May 2014 and to 10th Sep 2018. With this graph, the BJP govt is trying to show that the price of diesel has increased every 5 years. But during their tenure, the rate of increase is not as high as during the previous government’s tenure.
All well till here. But, as per congress, BJP missed to mention one important point. The prices of international crude oil, which are directly responsible for the retail prices of petrol and diesel in India. Below is a photo by Times of India showing the increase in central and state govt taxes since the BJP govt came into power.
Fuel rates have been a bone of contention between the ruling BJP Government and the Opposition party for sometime. It has been rising on a daily basis due to a dip in the rupee value and rise in crude oil rates. Though a cut in excise duty by the Union Government could bring in lower fuel prices, it could have an adverse impact on the fiscal deficit.
It may be remembered that the Union Govt had increased excise duty on petrol by Rs 11.77 per liter and by Rs 13.47 per liter on diesel in a total of 9 instalments during the period November 2014-January 2016 but then cut the tax by just Rs 2 per liter last October when global oil prices fell.
Collections from petroleum products had increased two fold in the past four years. It has gone up from Rs 99,184 crores in 2014-15 to Rs 2,29,019 crores in 2017-18 while VAT revenue from petroleum products increased from Rs 1,37,157 crores in 2014-15 to Rs 1,84,091 crores in 2017-18.