
Unlike December 2022, car sales January 2023 charts showed positive growth of 17.31% YoY and an even better 25.73% MoM growth

Car sales are usually low during the year-end. This is a pattern that is true almost every year. December 2022 was no exception as there was a severe MoM decline in total sales. Maruti Suzuki absolutely dominated sales charts like usual with figures almost triple that of 2nd highest seller, Hyundai.
At 1,47,348 units, Maruti Suzuki gained tremendously with 14.29% YoY growth over 1,28,924 units from a year ago and 1,12,010 units from a month before. Volume gain stood at 18,424 units YoY and 35,338 units MoM. Hyundai managed to cross Tata Motors sales and regained 2nd spot with 50,106 units. 13.82% YoY growth and 29.04% MoM growth were observed.
Car Sales Jan 2023
With just 2,119 units short of Hyundai, Tata car sales stood at 47,987 units. There was a decent gain of 17.68% YoY and a 19.83% gain MoM. Volume gain stood at 7,210 units YoY and 7,942 units MoM. SUV maker Mahindra took 4th spot with 33,040 units and registered 65.50% YoY growth and 16.61% MoM growth.
At 5th spot, we have Kia with 28,634 units sold in January 2023. Kia sales YoY gain was 48.22 and MoM gain was the highest in this list at 88.58%. Toyota and Honda sold 12,835 units and 7,821 units last month. Toyota saw 75.15% YoY growth and 23.16% MoM growth, while Honda sales declined YoY at a rate of 24.99% and MoM gain was 10.75%.
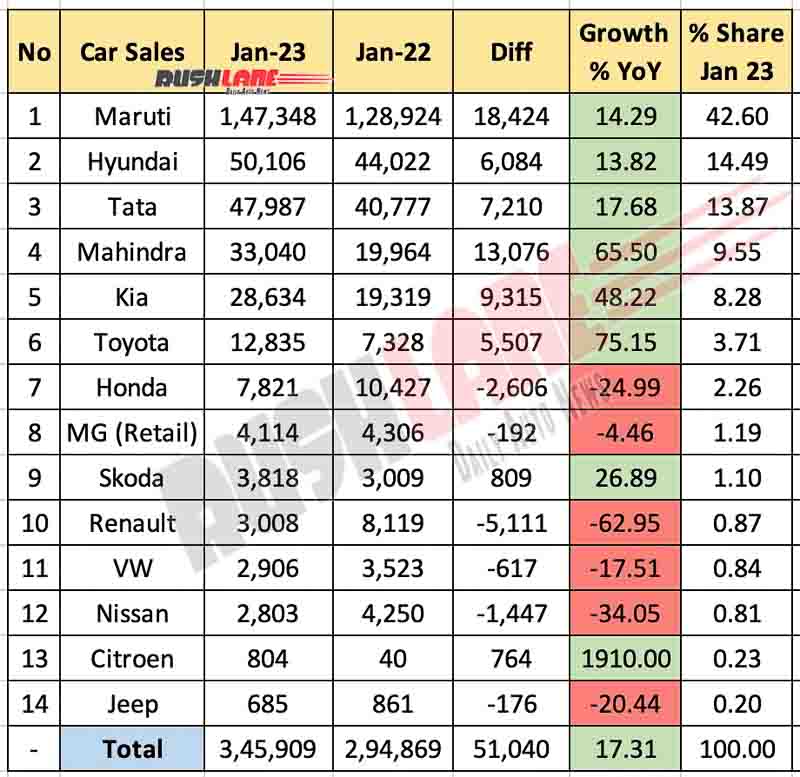
MG India retail sales were 4,114 units and followed a similar pattern as Honda with a 4.46% YoY decline and 5.51% MoM gain. Skoda, Renault, VW and Nissan sold 3818, 3008, 2906 and 2803 units respectively in January 2023. Only Skoda showed YoY gain of 26.89% and Nissan saw a 38.76% MoM gain and apart from that, there was no positive growth.
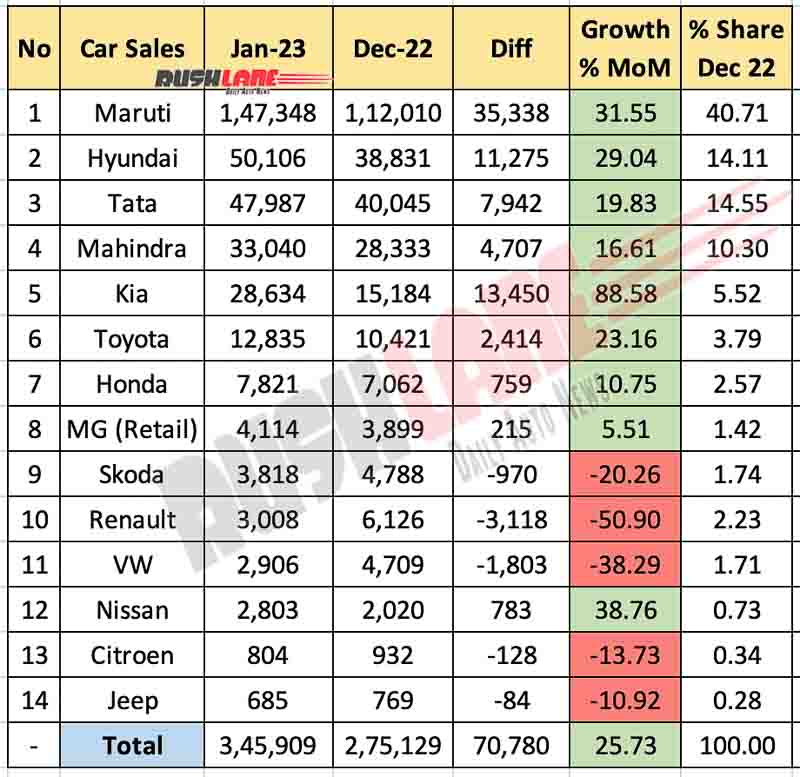
At 804 units, Citroen sales improved vastly YoY at 1910% with addition of C3 alongside C5 Aircross. C3 sales haven’t been enough as sales declined MoM by 13.73%. Jeep sold 685 units and fell into the red completely. With a total of 3,45, 909 units sold, car sales January 2023 chart showed positive growth of 17.31% YoY and 25.73% MoM. Volume gain stood at 51,040 units YoY and 70,780 units MoM.
Car Market Share Jan 2023
Where market share is concerned, Maruti Suzuki currently has 42.60%, down by 1.13% YoY and up by 1.89% MoM. Hyundai followed the same pattern as Maruti and lost market share YoY by 0.44% and gained 0.37% MoM. Currently, Hyundai has a market share of 14.49%. Tata, Mahindra, Kia and Toyota increased market share YoY to 13.87%, 9.55%, 8.28% and 3.71% respectively.
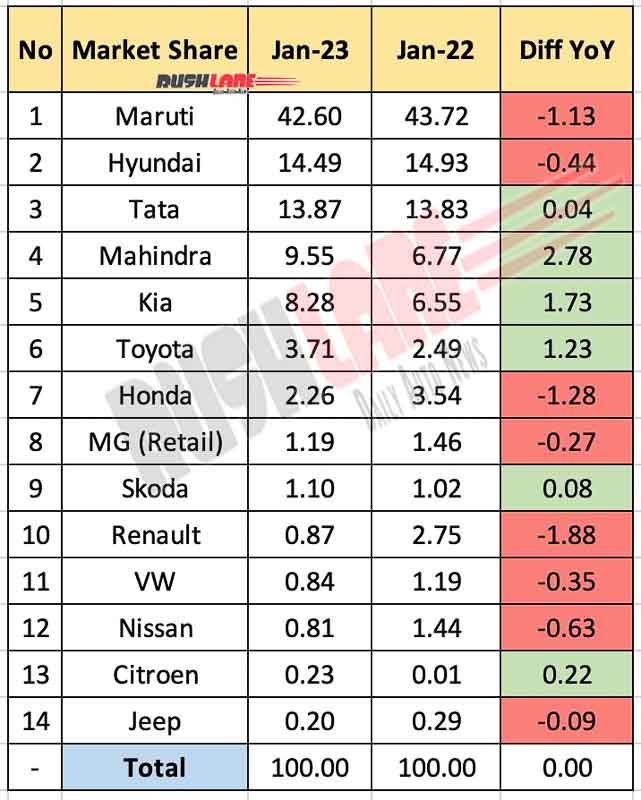
Only Kia saw MoM increase in market share of 2.76% and the rest registered a decline. MG, Skoda, Renault, and VW registered a market share of 1.19%, 1.10%, 0.87%, and 0.84% respectively. All of them registered a decline of market share in both YoY and MoM analysis, except for Skoda with 0.08% increment YoY.
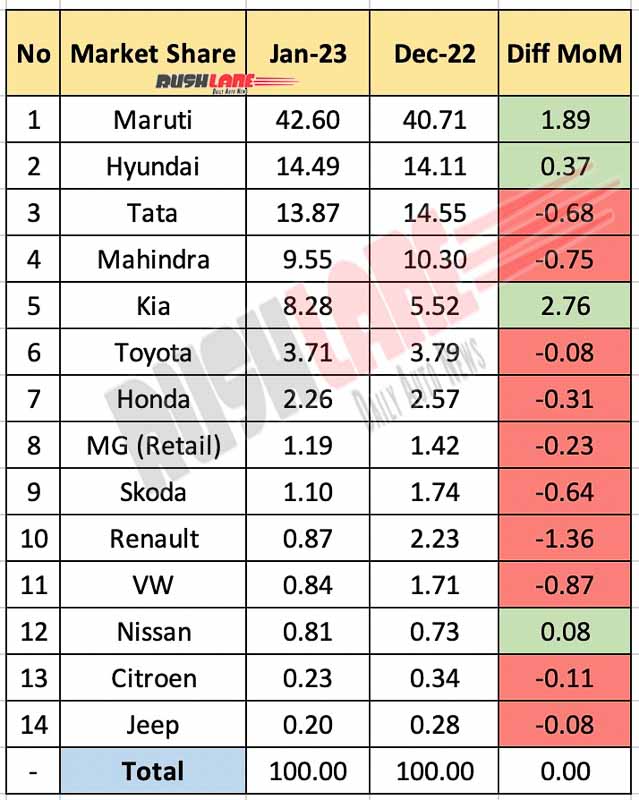
Nissan, Citroen and Jeep were found at the bottom of this list with 0.81%, 0.23% and 0.20% market share in January 2023. Market share of Citroen increased by 0.22% YoY and Nissan saw an increment of 0.08% MoM.