
Although passenger vehicles and two-wheelers have recorded an appreciable revival in sales, the commercial vehicle segment is still struggling
With businesses and markets gradually opening up post nationwide lockdown, the automotive industry has also started to revive. In these torrid times, sales have risen for the passenger vehicle segment and two-wheeler segment in the country. However, that is not the case for commercial vehicles.
The commercial vehicle segment is still reeling under the effect of a slowdown in the economy which has further accentuated from the ongoing crisis. This can be easily established by last month’s state-wise sales performance of commercial vehicles which witnessed an overall decline of over 57 percent YoY sales.
Since the economy of the country has been adversely affected due to this the supply chain has been severely impacted. This has led to a plunge in demand for commercial vehicles that mostly carry goods and supplies from one part of the country to another. Another big chunk of commercial vehicles is formed by public transportation which is still not yet active or partially active in many parts of the country.
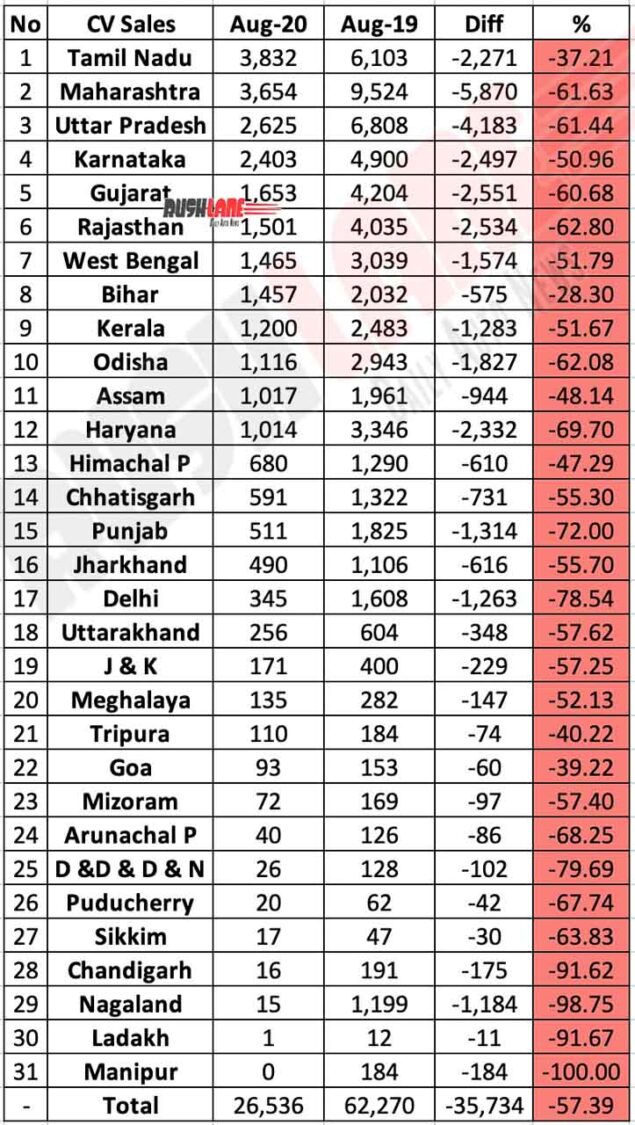
State-Wise Sales
As far as official data from FADA goes, Tamil Nadu (3,832) sold the maximum number of CV units last month followed closely by Maharashtra (3654). However, both these states witnessed a dip of 37 percent and 61 percent respectively when compared to sale in August last year. Similar is the case with Uttar Pradesh (2625) and Karnataka (2403) who recorded negative growth of 61 percent and 51 percent respectively.
Things do not look much bright for other states as well. Gujarat (1653), Rajasthan (1501), West Bengal (1465), Bihar (1457), Kerala (1200) and Odisha (1116) form rest of the top ten on the list. All states have registered degrowth in the range of 28 percent and 63 percent. Assam (1017) and Haryana (1014) are the only two other states which have registered four-digit sales figures. UTs and states like Ladakh and Manipur registered unitary and zero sales respectively.
Company Sales
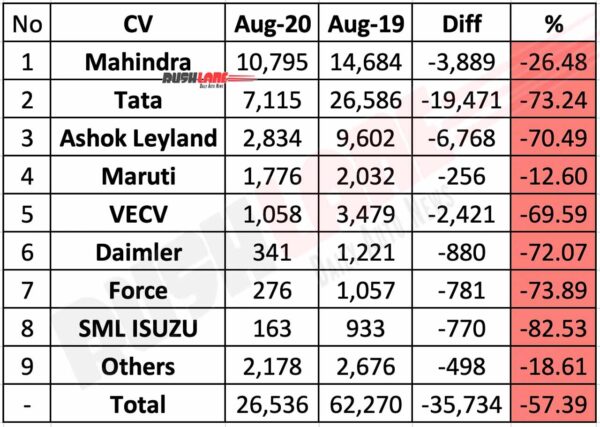
As low we go on the chart, the difference in YoY figures increases. The decline in demand for commercial vehicles can clearly be understood by the sales figures generated by different auto companies. For instance, Mahindra registered sales of 10795 units as opposed to 14,684 units. However, the good news is that its market share has increased significantly from 23 percent to 40 percent. Tata Motors, a leading commercial auto company, registered sales of 7,115 new CV units against a massive drop from 26,586 units sold last year during August this year.
FADA had earlier forecasted a revival of commercial vehicle sales which it did in comparison to the previous month. However, it is still miles to go before CVs reach the pre-COVID demand levels. There is hardly any scope for any drastic changes in the near future. Hopefully gradually we get to see a surge in demand.
Also Read:
Car Sales Aug 2020
Two Wheeler Sales Aug 2020
Tractor Sales Aug 2020
| No | CV Sales | Aug-20 | Aug-19 | Diff | % |
|---|---|---|---|---|---|
| 1 | Tamil Nadu | 3,832 | 6,103 | -2,271 | -37.21 |
| 2 | Maharashtra | 3,654 | 9,524 | -5,870 | -61.63 |
| 3 | Uttar Pradesh | 2,625 | 6,808 | -4,183 | -61.44 |
| 4 | Karnataka | 2,403 | 4,900 | -2,497 | -50.96 |
| 5 | Gujarat | 1,653 | 4,204 | -2,551 | -60.68 |
| 6 | Rajasthan | 1,501 | 4,035 | -2,534 | -62.80 |
| 7 | West Bengal | 1,465 | 3,039 | -1,574 | -51.79 |
| 8 | Bihar | 1,457 | 2,032 | -575 | -28.30 |
| 9 | Kerala | 1,200 | 2,483 | -1,283 | -51.67 |
| 10 | Odisha | 1,116 | 2,943 | -1,827 | -62.08 |
| 11 | Assam | 1,017 | 1,961 | -944 | -48.14 |
| 12 | Haryana | 1,014 | 3,346 | -2,332 | -69.70 |
| 13 | Himachal P | 680 | 1,290 | -610 | -47.29 |
| 14 | Chhatisgarh | 591 | 1,322 | -731 | -55.30 |
| 15 | Punjab | 511 | 1,825 | -1,314 | -72.00 |
| 16 | Jharkhand | 490 | 1,106 | -616 | -55.70 |
| 17 | Delhi | 345 | 1,608 | -1,263 | -78.54 |
| 18 | Uttarakhand | 256 | 604 | -348 | -57.62 |
| 19 | J & K | 171 | 400 | -229 | -57.25 |
| 20 | Meghalaya | 135 | 282 | -147 | -52.13 |
| 21 | Tripura | 110 | 184 | -74 | -40.22 |
| 22 | Goa | 93 | 153 | -60 | -39.22 |
| 23 | Mizoram | 72 | 169 | -97 | -57.40 |
| 24 | Arunachal P | 40 | 126 | -86 | -68.25 |
| 25 | D &D & D & N | 26 | 128 | -102 | -79.69 |
| 26 | Puducherry | 20 | 62 | -42 | -67.74 |
| 27 | Sikkim | 17 | 47 | -30 | -63.83 |
| 28 | Chandigarh | 16 | 191 | -175 | -91.62 |
| 29 | Nagaland | 15 | 1,199 | -1,184 | -98.75 |
| 30 | Ladakh | 1 | 12 | -11 | -91.67 |
| 31 | Manipur | 0 | 184 | -184 | -100.00 |
| – | Total | 26,536 | 62,270 | -35,734 | -57.39 |